> ## Documentation Index
> Fetch the complete documentation index at: https://docs.delphina.ai/llms.txt
> Use this file to discover all available pages before exploring further.
# Next Gen Data Apps (Beta)
> Live, editable dashboards with larger datasets, MCP data sources, agentic insights, and a gated draft-and-publish workflow
**Next Gen Data Apps (Beta) is available to a small set of workspaces right now.**
If you don't see it in your workspace, you're not in the beta group yet. Keep
using [Classic Data Apps](/analytics-agent/data-apps), which is unchanged. This
guide is for the beta users who have access; expect a few rough edges, and please
send us feedback.
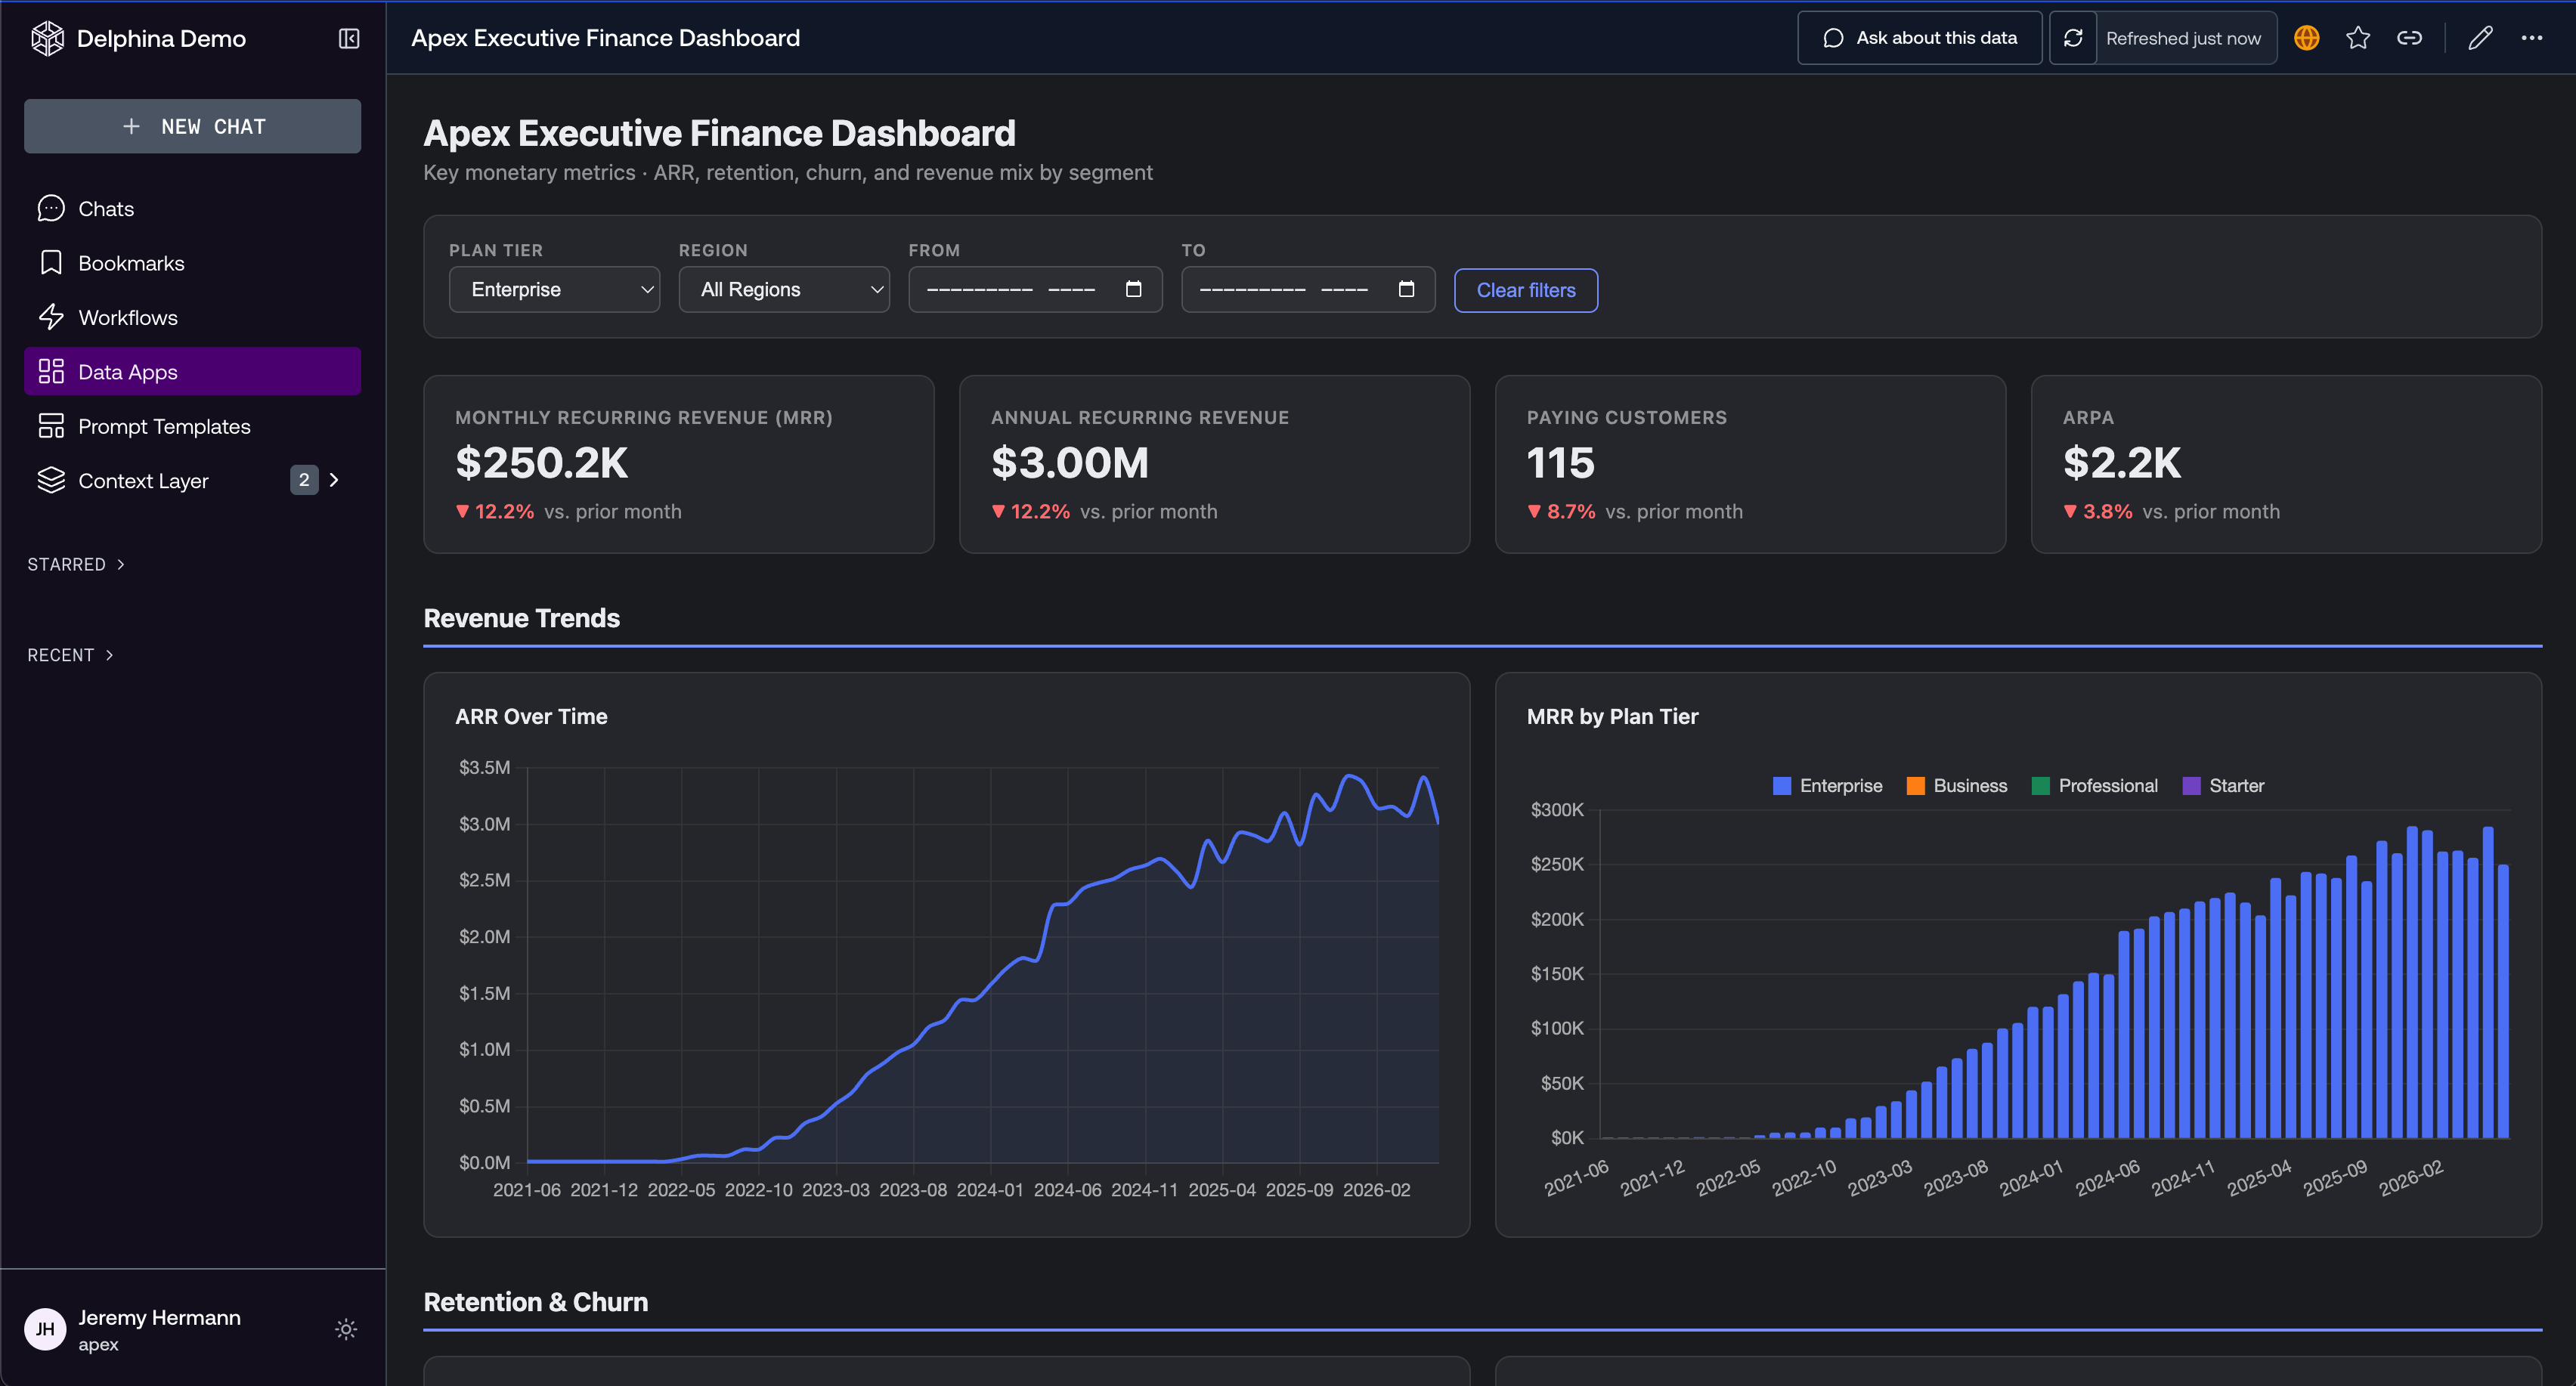
Next Gen Data Apps (Beta) is the next generation of [Classic Data Apps](/analytics-agent/data-apps): the same idea (AI-native, always-up-to-date dashboards), now with on-canvas editing and stronger guarantees around what your viewers see. It turns an analysis into a live dashboard you can edit directly on the canvas. You still build with chat, and now you can also drag panels, edit their properties, and rearrange the layout in place, then publish when it's ready. Every version is rebuilt through a checked pipeline, so a change that fails to render never reaches your viewers.
 ## What's new
* **Handles more data.** Dashboards can load much larger datasets, on the order of a million rows, in full. The heavy processing happens in the pipeline up front, so charts and filters stay fast even over large data.
* **Complete version history.** Every version is captured with a complete, reliable history. You can review exactly what changed before publishing, keep a clear split between your working draft and what viewers see, and restore any earlier version at any time.
* **Render-checked publishing.** Each version is rebuilt and render-checked before it goes live, so a broken change can't reach your viewers. The app keeps serving the last good version.
* **A structured app.** Next Gen apps are a React app of separate, editable components, which is what makes on-canvas editing and reliable rebuilds possible.
* **On-canvas editing.** Shape the dashboard directly on the canvas (drag, edit, rearrange), with chat always there when you want it.
* **More than your warehouse.** Pipelines can pull data from MCP data sources (for example, a GitHub connection) alongside your warehouse, so a dashboard can combine warehouse metrics with data from your connected tools.
* **AI-generated insights.** A pipeline can include an agent step that uses AI to produce content, such as a written insights summary of what the data shows, baked right into the app.
## Data sources and pipeline steps
Every Data App is produced by a pipeline: a DAG of steps, so independent steps run in parallel and each one runs as soon as its inputs are ready. Next Gen Data Apps (Beta) adds new data-step kinds beyond the warehouse-and-transform steps of Classic:
| Step | What it does |
| ------------------- | ---------------------------------------------------------------------------------------------------------------------------- |
| **Warehouse (SQL)** | Queries your data warehouse |
| **MCP** | Pulls data from a connected source (for example, a GitHub connection) via [MCP connections](/administration/mcp-connections) |
| **DuckDB (SQL)** | Local SQL transforms on staged data (reshape, join, roll up) |
| **Python** | Python for transforms or custom logic |
| **Agent** | Uses AI to generate content as a pipeline step, such as a written insights summary of the data |
Those datasets are rendered by a small React codebase (`App.tsx` plus one file per component under `components/`). You can browse both the data steps and the app code from the **Pipeline** tab in the editor.
## What's new
* **Handles more data.** Dashboards can load much larger datasets, on the order of a million rows, in full. The heavy processing happens in the pipeline up front, so charts and filters stay fast even over large data.
* **Complete version history.** Every version is captured with a complete, reliable history. You can review exactly what changed before publishing, keep a clear split between your working draft and what viewers see, and restore any earlier version at any time.
* **Render-checked publishing.** Each version is rebuilt and render-checked before it goes live, so a broken change can't reach your viewers. The app keeps serving the last good version.
* **A structured app.** Next Gen apps are a React app of separate, editable components, which is what makes on-canvas editing and reliable rebuilds possible.
* **On-canvas editing.** Shape the dashboard directly on the canvas (drag, edit, rearrange), with chat always there when you want it.
* **More than your warehouse.** Pipelines can pull data from MCP data sources (for example, a GitHub connection) alongside your warehouse, so a dashboard can combine warehouse metrics with data from your connected tools.
* **AI-generated insights.** A pipeline can include an agent step that uses AI to produce content, such as a written insights summary of what the data shows, baked right into the app.
## Data sources and pipeline steps
Every Data App is produced by a pipeline: a DAG of steps, so independent steps run in parallel and each one runs as soon as its inputs are ready. Next Gen Data Apps (Beta) adds new data-step kinds beyond the warehouse-and-transform steps of Classic:
| Step | What it does |
| ------------------- | ---------------------------------------------------------------------------------------------------------------------------- |
| **Warehouse (SQL)** | Queries your data warehouse |
| **MCP** | Pulls data from a connected source (for example, a GitHub connection) via [MCP connections](/administration/mcp-connections) |
| **DuckDB (SQL)** | Local SQL transforms on staged data (reshape, join, roll up) |
| **Python** | Python for transforms or custom logic |
| **Agent** | Uses AI to generate content as a pipeline step, such as a written insights summary of the data |
Those datasets are rendered by a small React codebase (`App.tsx` plus one file per component under `components/`). You can browse both the data steps and the app code from the **Pipeline** tab in the editor.
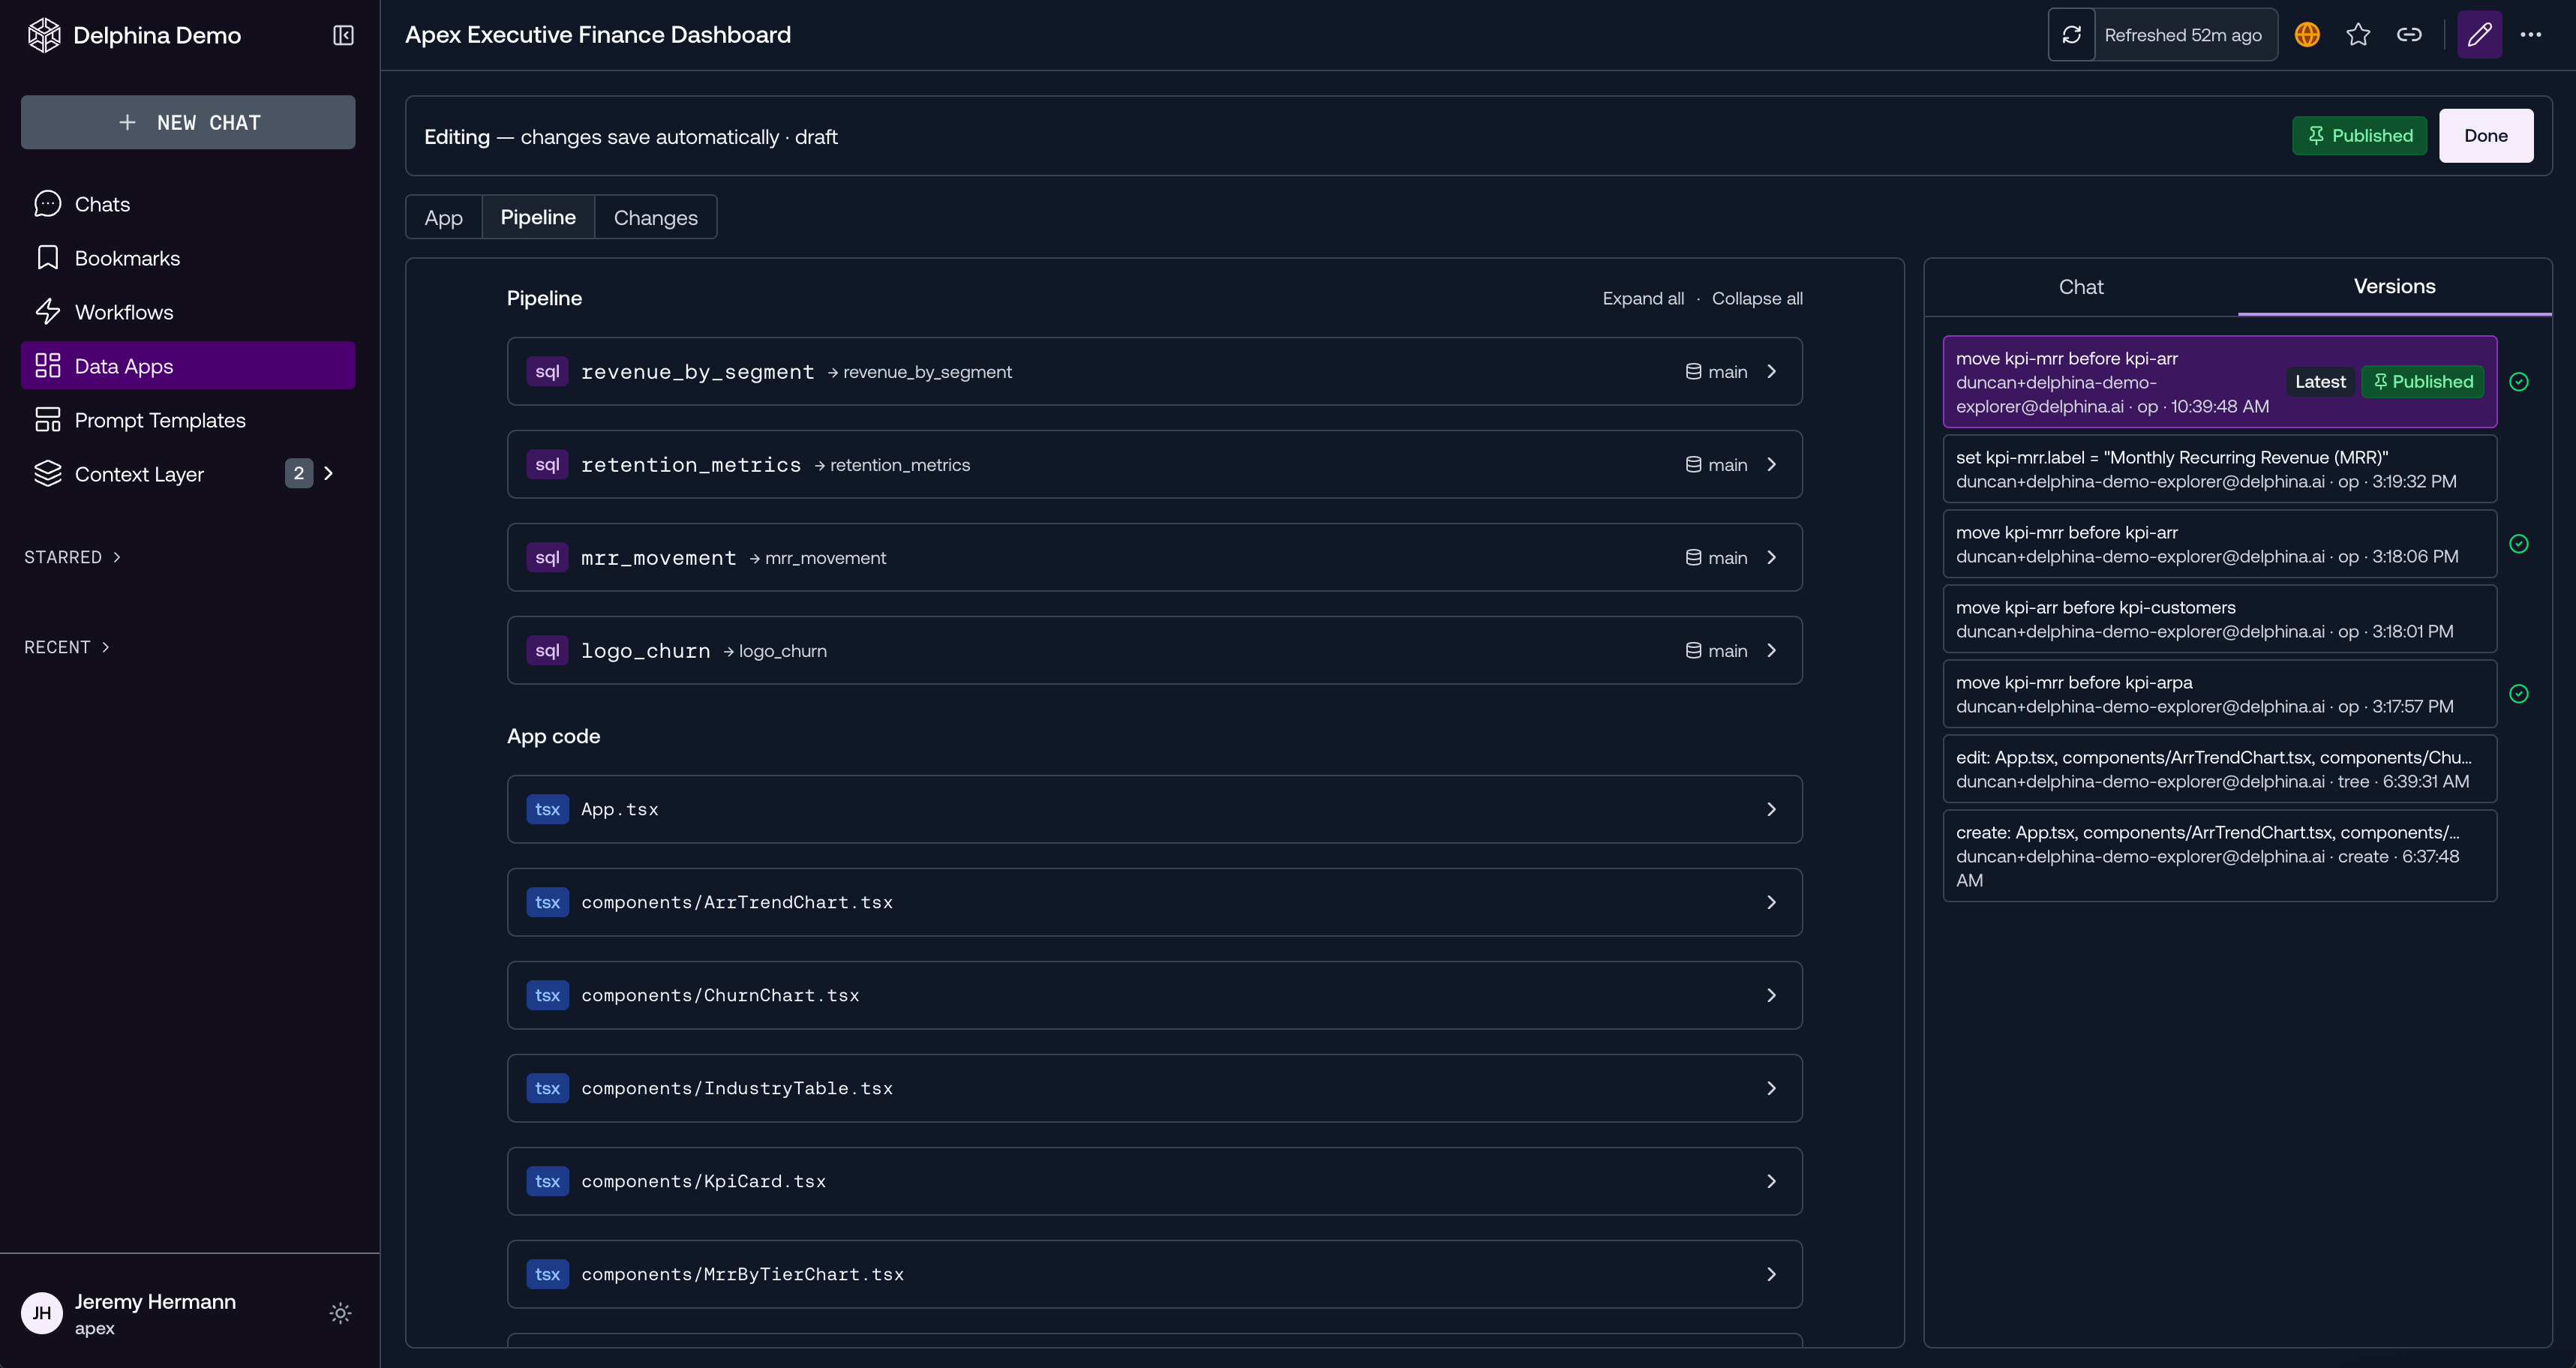 A run view organizes the pipeline into three groups: **Steps** (your data steps above), **Gate** (build, then render-check), and **Publish**. Because these steps are captured in the app itself, the whole dashboard is reproducible from its pipeline, and every rebuild is render-checked before it can be published (see [Refreshing](#refreshing)).
## Creating a Data App
Ask Delphina to analyze your data and iterate until the output looks right,
just like Classic.
Type "create data app" in the chat. Delphina extracts the pipeline (SQL,
transforms, and rendering) from your conversation and packages it as a Data App.
Open the app and shape it on the canvas: rearrange panels, edit properties,
add or remove components. You can also use chat to refine it by asking Delphina
to make changes in words. Iterate until you're happy.
Publish the current version to release it to your viewers (see [Draft and publish](#draft-and-publish)).
You can also start from scratch with **+ Create Data App** on the Data Apps page and describe what you want.
A run view organizes the pipeline into three groups: **Steps** (your data steps above), **Gate** (build, then render-check), and **Publish**. Because these steps are captured in the app itself, the whole dashboard is reproducible from its pipeline, and every rebuild is render-checked before it can be published (see [Refreshing](#refreshing)).
## Creating a Data App
Ask Delphina to analyze your data and iterate until the output looks right,
just like Classic.
Type "create data app" in the chat. Delphina extracts the pipeline (SQL,
transforms, and rendering) from your conversation and packages it as a Data App.
Open the app and shape it on the canvas: rearrange panels, edit properties,
add or remove components. You can also use chat to refine it by asking Delphina
to make changes in words. Iterate until you're happy.
Publish the current version to release it to your viewers (see [Draft and publish](#draft-and-publish)).
You can also start from scratch with **+ Create Data App** on the Data Apps page and describe what you want.
 ## Editing on the canvas
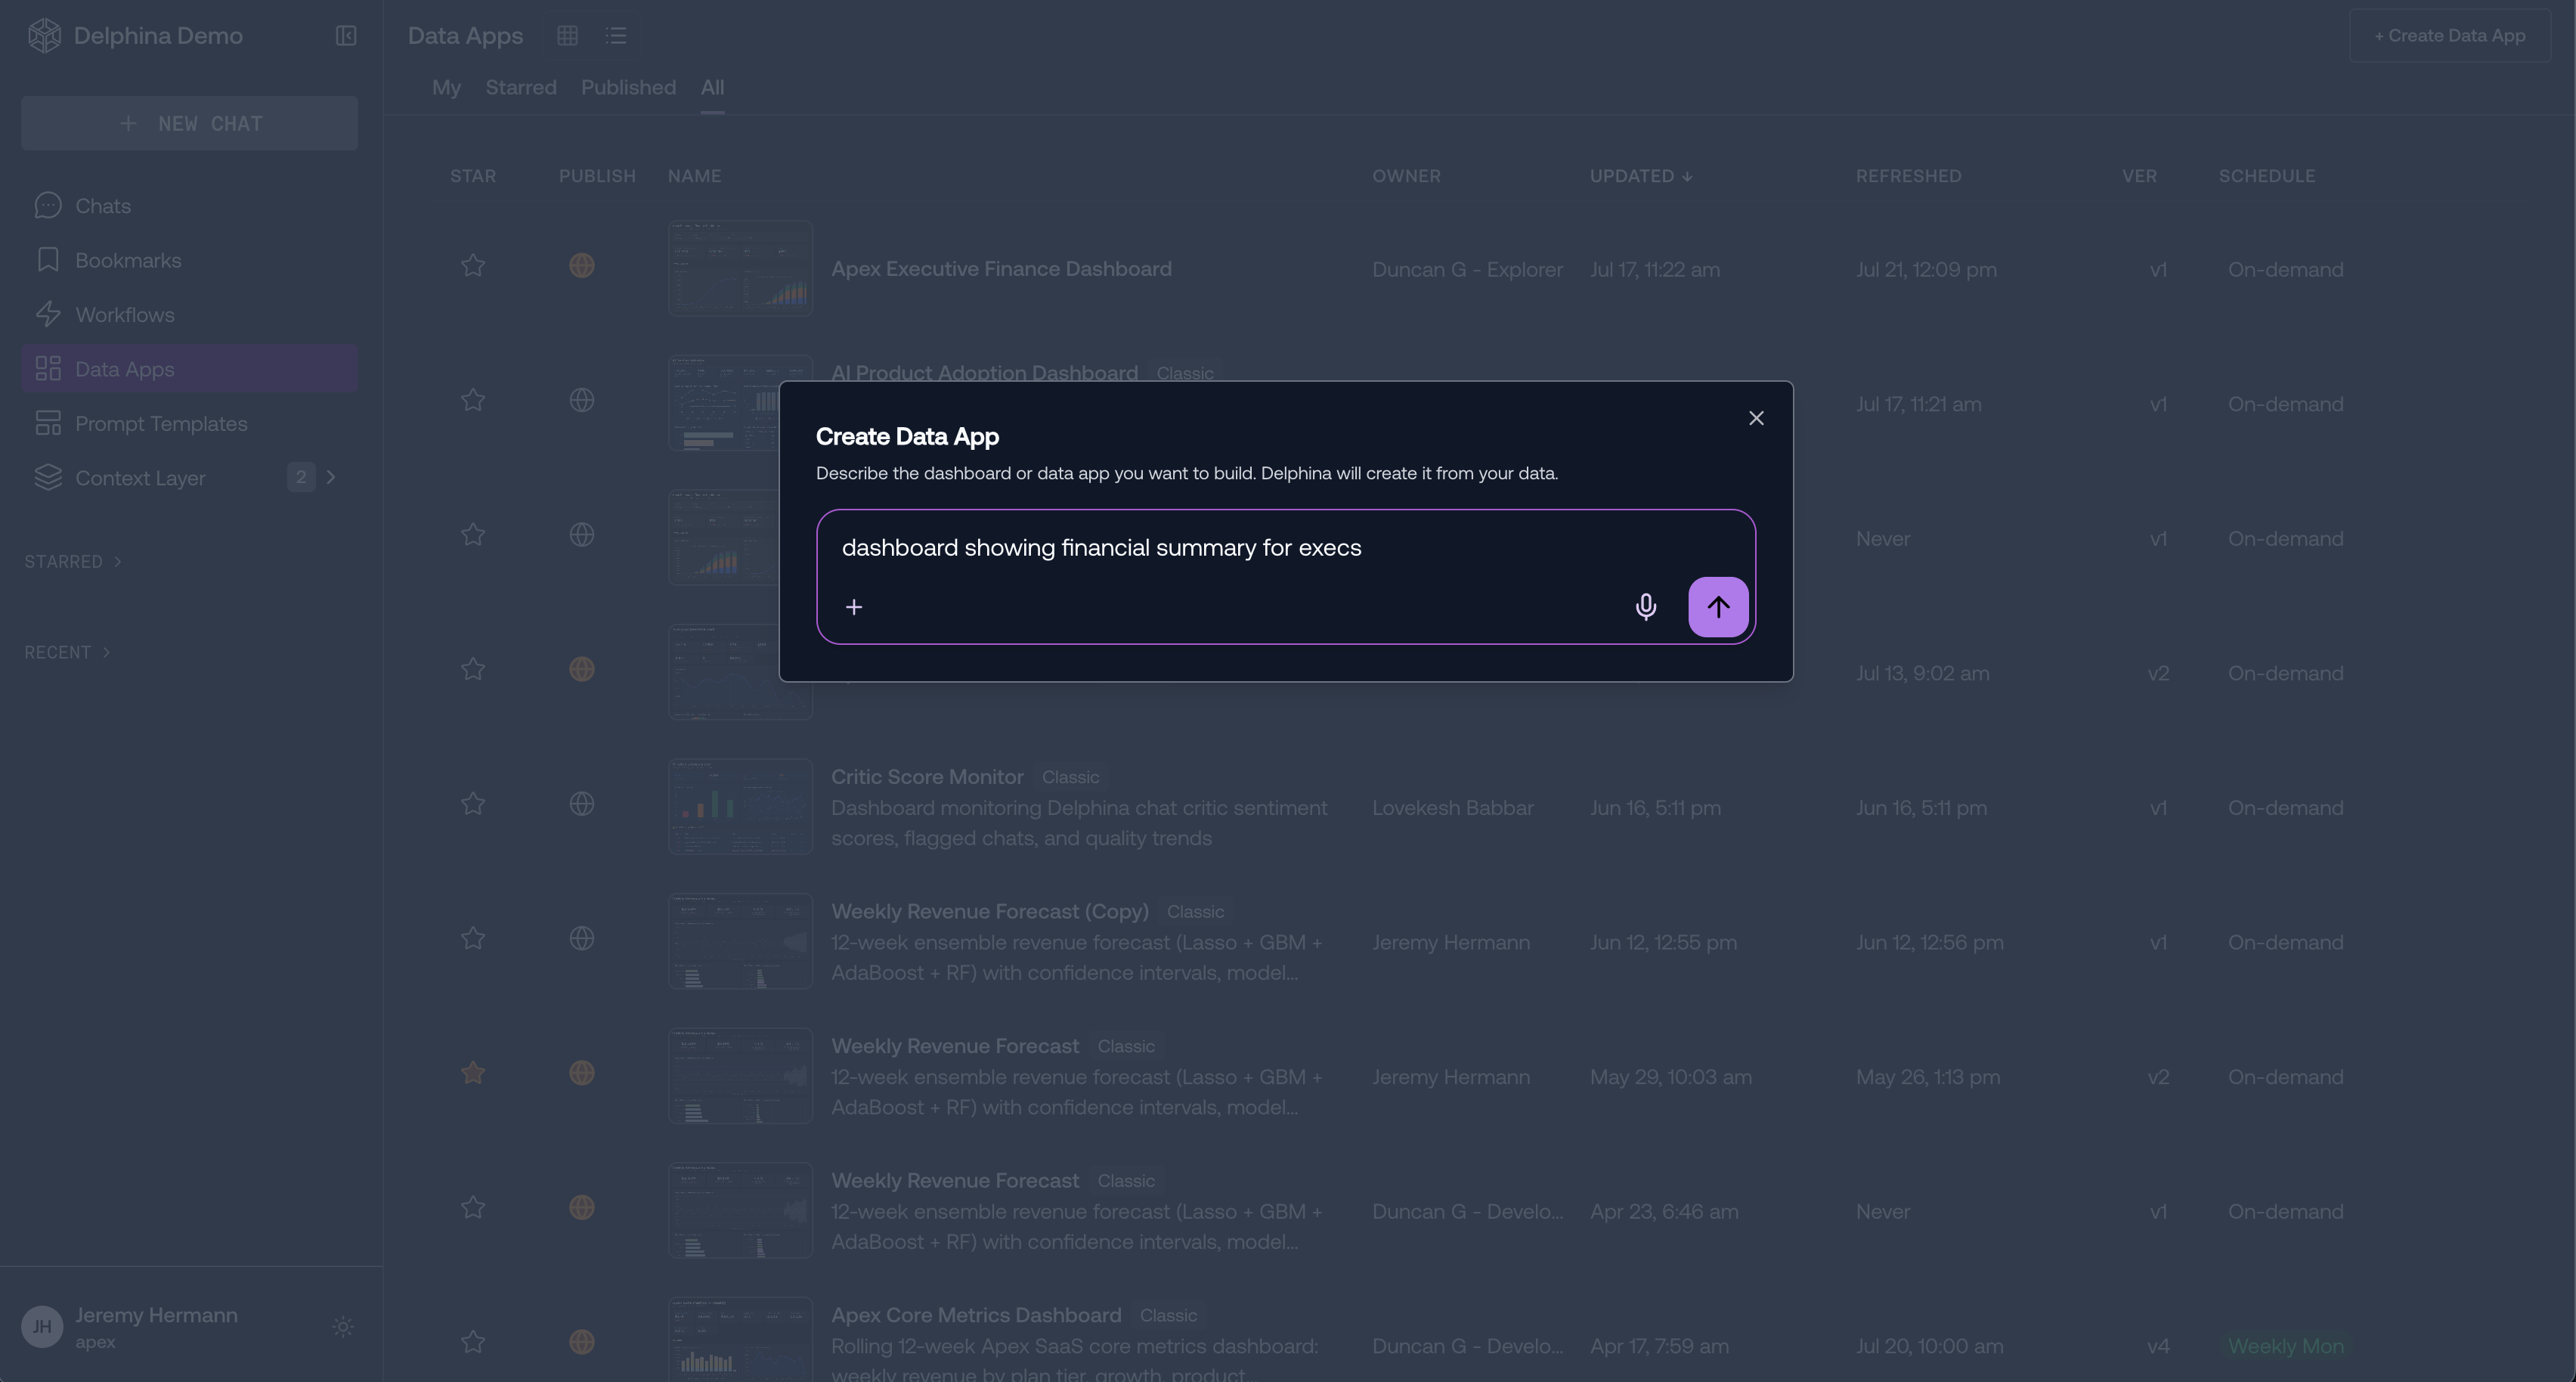
You can change the dashboard in place, right on the canvas. In edit mode, hover or select a component to reveal its controls:
* **Edit props:** change a component's settings (for example, a chart's type, axes, or color)
* **Drag to reorder:** rearrange components within the layout
* **Delete component:** remove a panel
* **Ask about this component:** open a focused chat to have Delphina change that panel
You can also chat about a component while simply viewing the app: select it and choose **Ask about this data** to ask questions about the data behind that panel. In both modes Delphina has the app's pipeline and data in context, so it can answer questions about the output and make edits.
## Editing on the canvas
You can change the dashboard in place, right on the canvas. In edit mode, hover or select a component to reveal its controls:
* **Edit props:** change a component's settings (for example, a chart's type, axes, or color)
* **Drag to reorder:** rearrange components within the layout
* **Delete component:** remove a panel
* **Ask about this component:** open a focused chat to have Delphina change that panel
You can also chat about a component while simply viewing the app: select it and choose **Ask about this data** to ask questions about the data behind that panel. In both modes Delphina has the app's pipeline and data in context, so it can answer questions about the output and make edits.
 ## Draft and publish
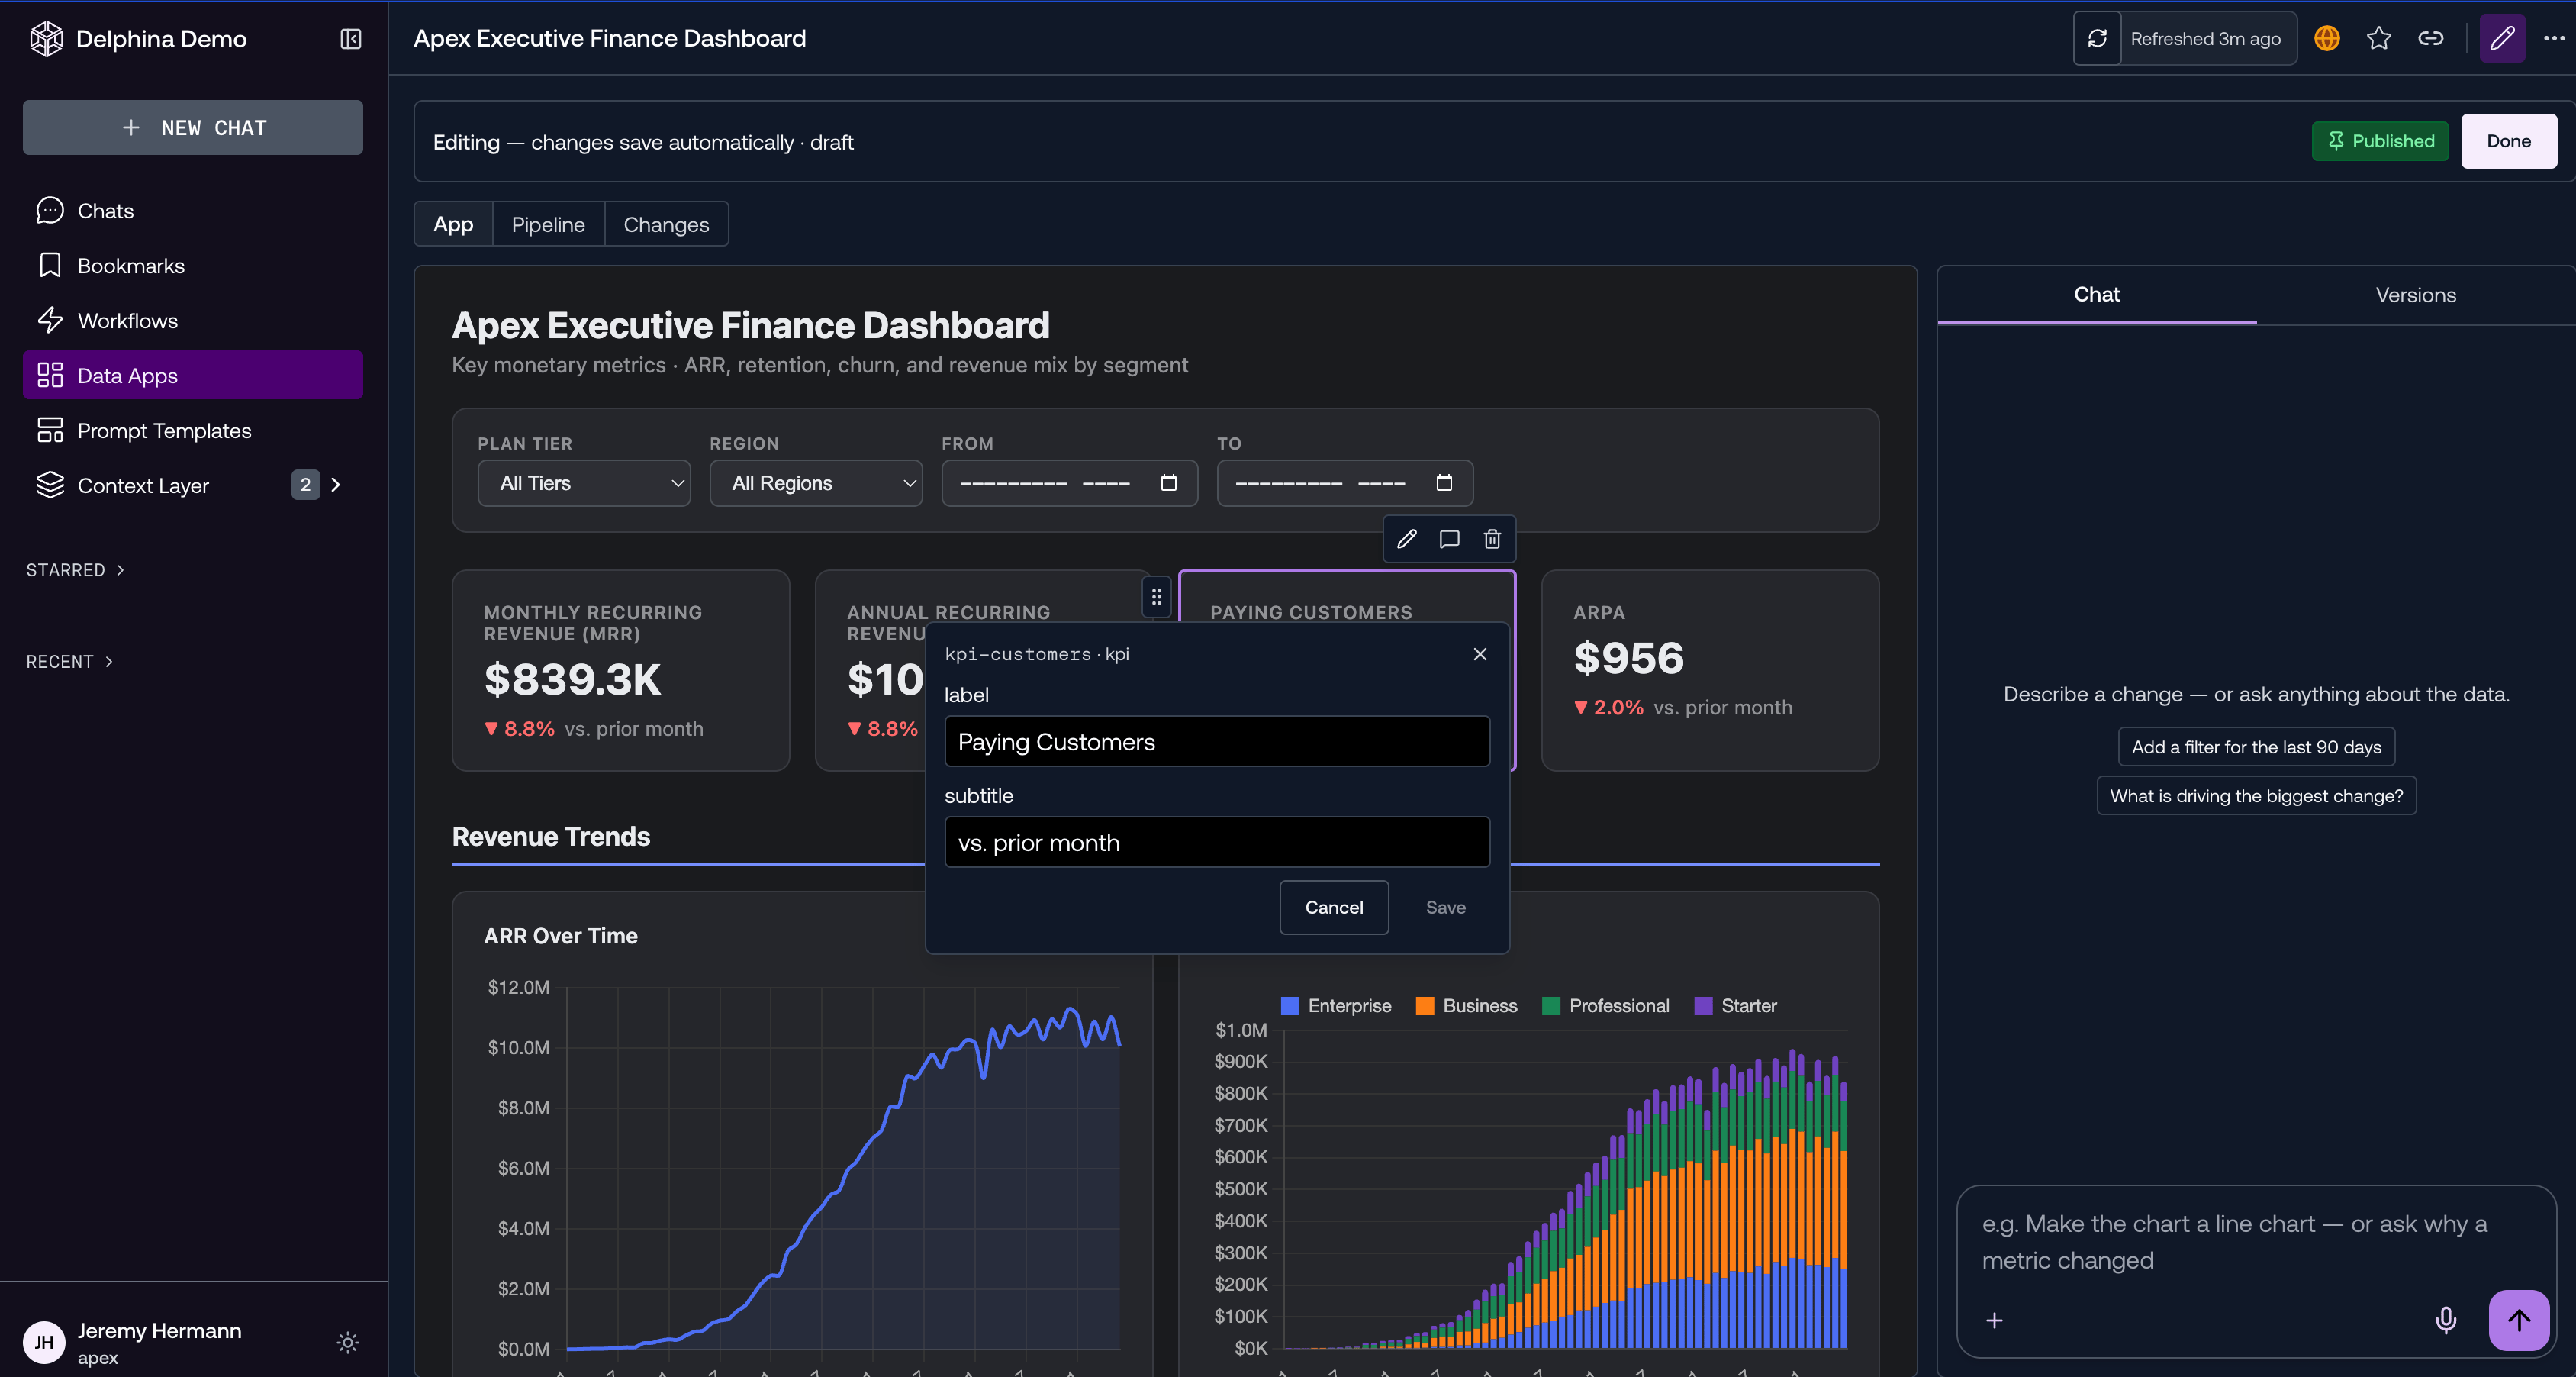
This is the biggest change from Classic. Your edits save automatically to a draft. The editor banner reads *"Editing — changes save automatically · draft"*, so you can shape a dashboard fully before anyone else sees it. Nothing your viewers see changes until you publish.
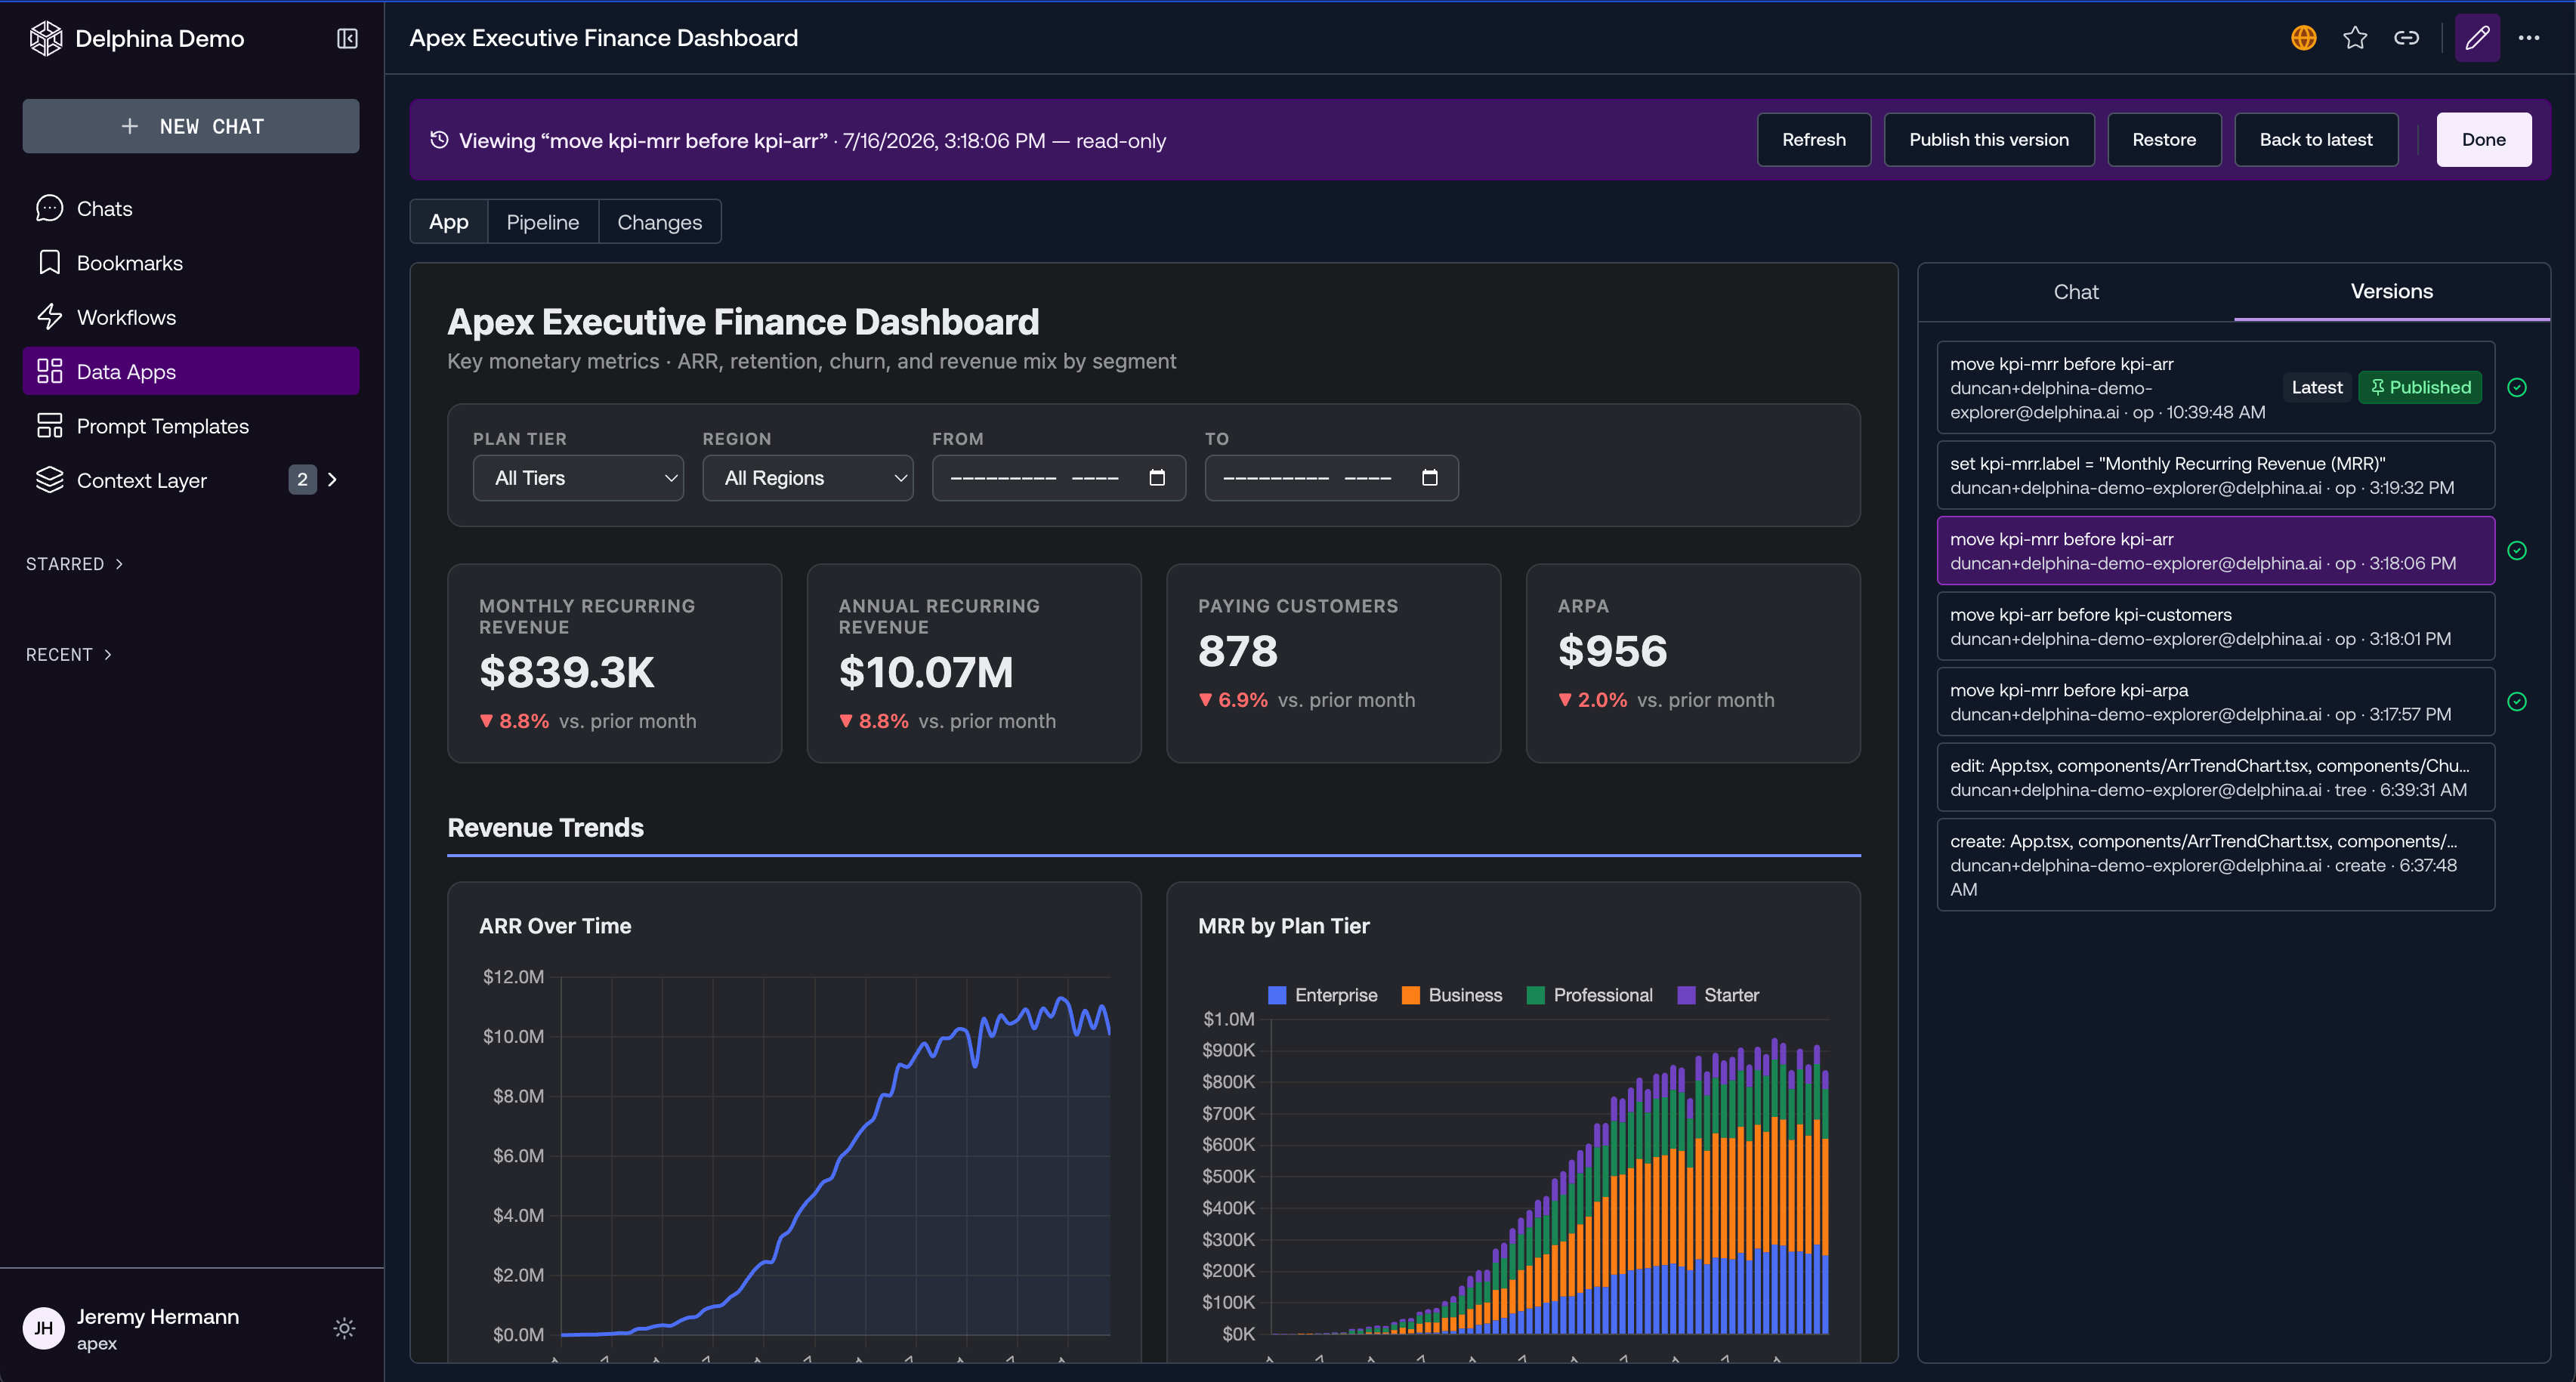
* The **Versions** panel (right rail) marks your working draft as Latest and the live version as Published.
* Open the **Changes** tab to review what's different from the published version.
* To make a version live, open it in the **Versions** panel and click **Publish this version**. You can also **Restore** an earlier version or jump **Back to latest**.
Viewers always see the Published version. Your draft edits are private to
you (and other editors) until you publish.
## Draft and publish
This is the biggest change from Classic. Your edits save automatically to a draft. The editor banner reads *"Editing — changes save automatically · draft"*, so you can shape a dashboard fully before anyone else sees it. Nothing your viewers see changes until you publish.
* The **Versions** panel (right rail) marks your working draft as Latest and the live version as Published.
* Open the **Changes** tab to review what's different from the published version.
* To make a version live, open it in the **Versions** panel and click **Publish this version**. You can also **Restore** an earlier version or jump **Back to latest**.
Viewers always see the Published version. Your draft edits are private to
you (and other editors) until you publish.
 ## Refreshing
Refresh re-runs the app's pipeline against your latest data (warehouse and any MCP sources). The analysis logic is frozen, so a refresh changes the data, not the design.
* **Manual:** click **Refresh now**.
* **Scheduled:** set a frequency in the app's settings (for example, daily).
Every refresh replays the pipeline through the same stages: your data **Steps** run, a **Gate** builds the app and render-checks it, then **Publish** releases it. If a refresh fails the render-check, the app keeps serving the last good version and surfaces the failure. Open the run from the failure banner to see what went wrong.
## Versions
Next Gen Data Apps (Beta) keeps a complete, reliable history of your app. Every version is captured automatically, so you can always see how a dashboard evolved and roll back with confidence.
* **See the timeline.** Open the Versions history to browse every version, with the current Published version and your Latest draft clearly marked.
* **Review before you publish.** Use **View changes** to see exactly what's different between your unreleased draft and the published version.
* **Restore any version.** Restoring makes that version your current draft, which you can review and then publish. Nothing is lost; restoring is itself just another version.
Because each version is rebuilt through the gated pipeline, restoring or publishing an older version is always render-checked too, so you can't accidentally publish a version that no longer renders.
## Sharing, publishing, and cloning
* **Publishing to viewers:** publishing a version (above) controls what content viewers see. Making the app discoverable in the workspace listing works the same way as Classic (see [Publishing](/analytics-agent/data-apps#publishing) and [Ownership](/analytics-agent/data-apps#ownership)).
* **Clone:** create your own copy of any app you can view. The clone starts from the same pipeline and output with independent version history.
* **Star:** pin an app to your sidebar for quick access.
## Migrating from Classic
During the beta there is no automatic conversion from a Classic Data App.
Migrating means recreating it as a new Next Gen Data App (Beta).
The quickest way is to point Delphina at the Classic app and ask it to rebuild it:
Open the Classic Data App and copy its URL from your browser.
In a chat, paste this prompt with your app's URL:
```text theme={null}
please migrate this classic data app to next gen:
```
Delphina reads the Classic app and creates a new Next Gen Data App (Beta) from it.
Confirm the new app matches (check the data, layout, and refresh), then
publish it and point your audience at the new app.
A few things to know before you migrate:
* The new app has a new URL; the Classic app is not modified.
* Stars, shares, and version history do not carry over, so you'll re-publish and re-share the new app.
* Keep the Classic app until you've verified the replacement, then delete or archive the original.
## Refreshing
Refresh re-runs the app's pipeline against your latest data (warehouse and any MCP sources). The analysis logic is frozen, so a refresh changes the data, not the design.
* **Manual:** click **Refresh now**.
* **Scheduled:** set a frequency in the app's settings (for example, daily).
Every refresh replays the pipeline through the same stages: your data **Steps** run, a **Gate** builds the app and render-checks it, then **Publish** releases it. If a refresh fails the render-check, the app keeps serving the last good version and surfaces the failure. Open the run from the failure banner to see what went wrong.
## Versions
Next Gen Data Apps (Beta) keeps a complete, reliable history of your app. Every version is captured automatically, so you can always see how a dashboard evolved and roll back with confidence.
* **See the timeline.** Open the Versions history to browse every version, with the current Published version and your Latest draft clearly marked.
* **Review before you publish.** Use **View changes** to see exactly what's different between your unreleased draft and the published version.
* **Restore any version.** Restoring makes that version your current draft, which you can review and then publish. Nothing is lost; restoring is itself just another version.
Because each version is rebuilt through the gated pipeline, restoring or publishing an older version is always render-checked too, so you can't accidentally publish a version that no longer renders.
## Sharing, publishing, and cloning
* **Publishing to viewers:** publishing a version (above) controls what content viewers see. Making the app discoverable in the workspace listing works the same way as Classic (see [Publishing](/analytics-agent/data-apps#publishing) and [Ownership](/analytics-agent/data-apps#ownership)).
* **Clone:** create your own copy of any app you can view. The clone starts from the same pipeline and output with independent version history.
* **Star:** pin an app to your sidebar for quick access.
## Migrating from Classic
During the beta there is no automatic conversion from a Classic Data App.
Migrating means recreating it as a new Next Gen Data App (Beta).
The quickest way is to point Delphina at the Classic app and ask it to rebuild it:
Open the Classic Data App and copy its URL from your browser.
In a chat, paste this prompt with your app's URL:
```text theme={null}
please migrate this classic data app to next gen:
```
Delphina reads the Classic app and creates a new Next Gen Data App (Beta) from it.
Confirm the new app matches (check the data, layout, and refresh), then
publish it and point your audience at the new app.
A few things to know before you migrate:
* The new app has a new URL; the Classic app is not modified.
* Stars, shares, and version history do not carry over, so you'll re-publish and re-share the new app.
* Keep the Classic app until you've verified the replacement, then delete or archive the original.